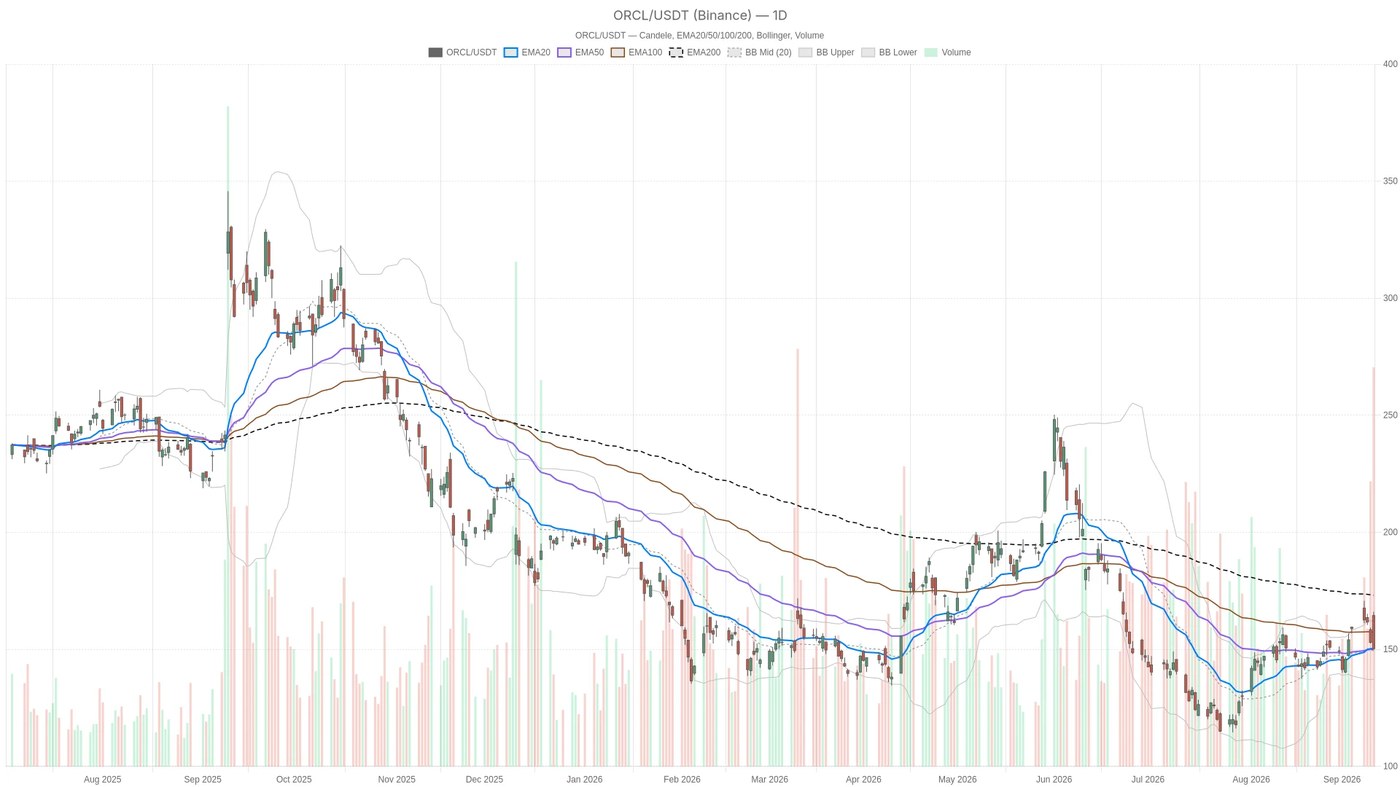
Oracle stock is trading at a genuine crossroads. After its worst week in nearly two months, shares closed at $150.28, a sharp reversal from an open near $164.43 and a session high of $166. That single candle captures a market caught between panic selling and stubborn institutional confidence.
Key takeaways
- Oracle stock closed at $150.28 after a sharp weekly reversal from $166, marking its worst week in nearly two months.
- Daily RSI14 sits at 51.05 — dead neutral — while MACD still shows a positive histogram of 0.47, though this likely reflects prior strength.
- Daily ATR14 has widened to 7.49, confirming unusually elevated volatility across timeframes.
- Hourly RSI14 has dropped to 32.54, nearing oversold, with MACD turning negative at -1.78 versus a signal of -0.87.
- Larry Ellison canceled a $7.5 billion stock sale, while Barclays raised its price target to $252 with an Overweight rating.
Daily chart: a genuine standoff in Oracle stock
The daily picture is genuinely mixed. Price sits almost exactly on top of the EMA20 at 150.25 and the EMA50 at 149.99. This rare confluence usually signals indecision rather than direction. Meanwhile, the EMA200 sits far above at 173.04, a reminder that the broader trend structure remains damaged after the recent drawdown.
Daily RSI14 at 51.05 is right in neutral territory. It is neither overbought nor oversold, which reinforces the idea that the market hasn’t yet chosen a side. MACD on the daily still shows a positive histogram of 0.47, with the MACD line at 3.21 above the signal at 2.74. That’s technically a bullish reading, but it’s a lagging one. Given the size of last week’s decline, this positive MACD likely reflects the strong move before the drop rather than genuine current strength.
Daily ATR14 stands at 7.49, an unusually wide range that confirms just how volatile Oracle stock has become. Bollinger Bands place price near the mid-line at 149.38. The upper band sits at 161.61 and the lower band at 137.15 — a wide envelope leaving room for movement in either direction without technically breaking structure.
Key daily levels to watch
The daily pivot point sits at 155.37, with resistance at 160.91 and support at 144.75. These levels will likely define the next directional attempt. A break above the pivot would shift the short-term bias. A break below support would open the door toward the lower Bollinger band.
Hourly momentum tells a different story for ORCL
On the 1H timeframe, the picture weakens noticeably. Price at 150.25 is trading below both the EMA20 at 154.98 and the EMA50 at 154.84, though it remains above the EMA200 at 147.61. That’s a short-term bearish structure layered on top of a longer intraday uptrend — exactly the kind of conflict that makes Oracle stock tricky to read right now.
RSI14 on the hourly chart has dropped to 32.54, edging close to oversold conditions. Meanwhile, MACD confirms the same fatigue. The line sits at -1.78 versus a signal of -0.87, producing a negative histogram of -0.91. The selling pressure that hit the daily chart hasn’t faded yet at the hourly level.
Price is also hugging the lower Bollinger band at 147.91 versus a mid-line of 156.62. It’s trading right near the hourly S1 pivot at 149.45. Overall, the 1H timeframe actively complicates the daily’s neutral read, tilting the near-term bias toward caution rather than recovery.
15-Minute execution context
Zooming into the 15m chart, the system flags an explicitly bearish regime. RSI14 at 31.74 is deep in oversold territory. Price is trading below all three EMAs — EMA20 at 152.16, EMA50 at 154.38, and EMA200 at 155.00. That’s a clean bearish stack. At the same time, MACD has essentially flattened, with the line and signal both at -1.12 and a histogram of zero. This flattening often hints at exhaustion in the immediate move, even without confirming a reversal.
Price is pressing against the lower Bollinger band at 150.02, with a mid-line at 152.07. The 15m pivot levels are tight — pivot at 150.31, resistance at 150.78, support at 149.79. For traders watching execution, this narrow range around the pivot is the level to monitor for the next short-term move, whether a bounce attempt or a fresh push lower.
The news flow complicates the Oracle stock narrative
Fundamentally, the backdrop is just as split as the charts. Oracle has faced mounting concerns over AI infrastructure spending, financing needs, and customer concentration. These explain the severity of last week’s decline. Notably, shares are now down roughly 50% over the past year, a figure that has investors debating whether this is a value opportunity or a warning sign.
However, sentiment got a notable boost when Larry Ellison canceled a locked-in $7.5 billion stock sale without explanation. Retail traders have interpreted this as a strong signal of confidence from Oracle’s own leadership. Barclays reinforced that optimism by raising its price target to $252 while maintaining an Overweight rating, citing strong fiscal Q1 growth and improved funding conditions.
Separately, a Seeking Alpha analysis argued that Oracle stock looks undervalued given surging cloud infrastructure and AI demand. Therefore, the fundamental case remains constructive even as the near-term technical picture stays fragile. The tug-of-war between these two narratives defines the current setup.
Bullish scenario for Oracle stock
For bulls to regain control, Oracle stock needs to reclaim the EMA20/EMA50 confluence around the $150 level on the daily chart. It must then push through the pivot at 155.37, with resistance at 160.91 as the next real test. A daily RSI climbing back above the mid-50s, paired with an expanding MACD histogram, would suggest momentum is genuinely turning rather than just reflecting lagging signals.
Ellison’s canceled sale and Barclays’ $252 target give the bullish case real fundamental backing. Any stabilization on the hourly chart above the EMA20 near 155 would add technical confirmation to this scenario.
Bearish scenario for Oracle stock
In contrast, the bearish case gains weight if price breaks below the daily S1 support at 144.75. That would open the door toward the lower Bollinger band at 137.15. A continuation of the current hourly and 15m weakness would confirm the sell-off isn’t finished. Specifically, RSI staying pinned near oversold and MACD histograms staying negative point to persistent pressure.
The EMA200 on the daily chart at 173.04 remains a long way above the current price, underscoring that the broader trend has not been repaired. Concerns over AI spending, financing, and customer concentration would need to resurface or intensify to invalidate the bullish thesis outright.
Closing take
Overall, Oracle stock is navigating a genuine tug-of-war between a damaged short-term chart and a resilient fundamental narrative. The daily timeframe reads as neutral. The hourly weakens that view. The 15-minute chart confirms outright bearish pressure in the immediate term. Meanwhile, elevated ATR readings across timeframes point to a stock where volatility — not direction — is the dominant theme right now. Positioning here demands patience, tight risk control, and close attention to the key pivot and support levels outlined above. The next decisive move, in either direction, is likely to happen fast.
FAQ
What are the key support and resistance levels for Oracle stock right now?
The daily pivot sits at 155.37, with resistance at 160.91 and support at 144.75. On the hourly chart, S1 support is at 149.45. A break below 144.75 would open the path toward the lower daily Bollinger band at 137.15.
What do the technical indicators say about Oracle stock’s current momentum?
The daily chart is neutral, with RSI14 at 51.05 and price sitting on the EMA20/EMA50 confluence near $150. However, the hourly chart is clearly weaker, with RSI14 at 32.54 and MACD turning negative. The 15-minute chart shows a bearish EMA stack, suggesting near-term selling pressure remains dominant.
What fundamental factors are influencing Oracle stock right now?
Larry Ellison canceled a locked-in $7.5 billion stock sale, which retail traders view as a confidence signal. Barclays raised its price target to $252 with an Overweight rating, citing strong fiscal Q1 growth. However, concerns over AI infrastructure spending, financing needs, and customer concentration continue to weigh on sentiment.
Disclaimer: This article is for informational purposes only and does not constitute financial advice, an investment recommendation, or a solicitation to buy or sell any financial instrument or cryptocurrency. The analysis provided is not indicative of future results. Investing in crypto assets and financial markets carries a high risk of capital loss. Always do your own research (DYOR) and consult a qualified financial advisor before making any decision.
Article produced with the assistance of artificial intelligence and reviewed by the editorial team.